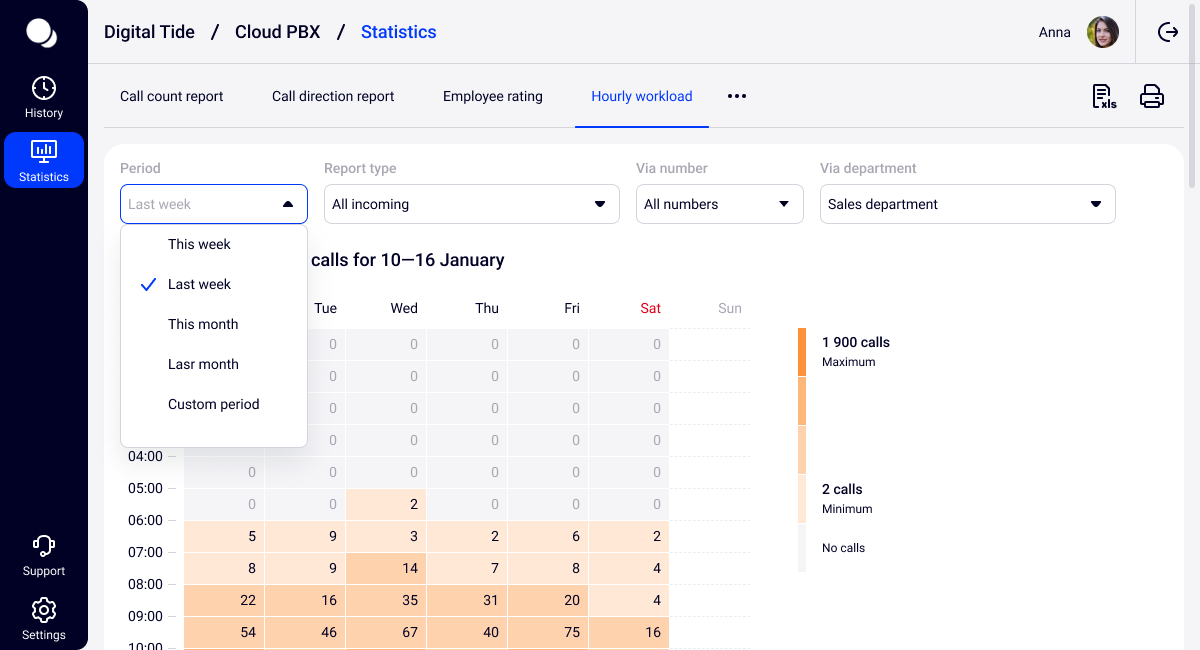
Hourly Workload Report Capabilities
The Hourly Workload report shows at what time and on what days of the week employees communicate with customers most often and the longest.
Report Types
1. By incoming calls you will be able to evaluate your customers’ activity during the day.
2. By all outgoing calls — your employees’ activity and their ability to evenly distribute the workload throughout the day in order to sell more.
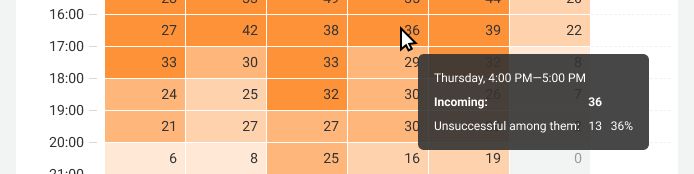
3. By unsuccessful outgoing calls you will understand at what time customers are less likely to pick up and when it is more effective to call them. To be objective, consider not only the amount of unsuccessful outgoing calls but also their share among all outgoing calls at the selected hour. To find out the share of unsuccessful calls among all outgoing calls, open the report for all outgoing calls and hover the cursor over any cell.
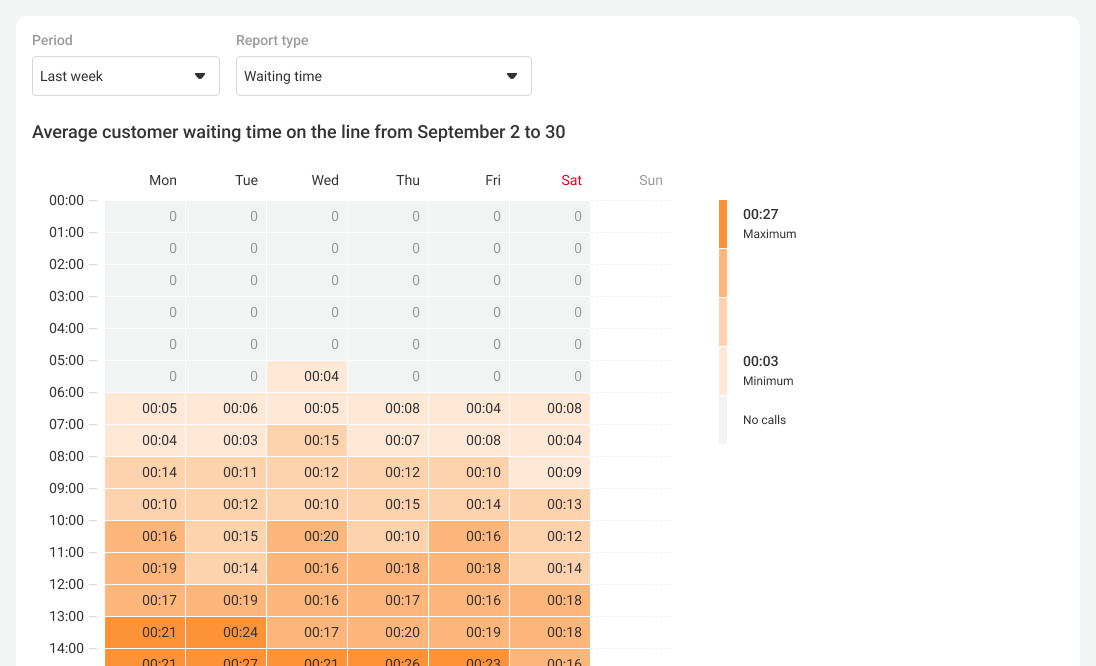
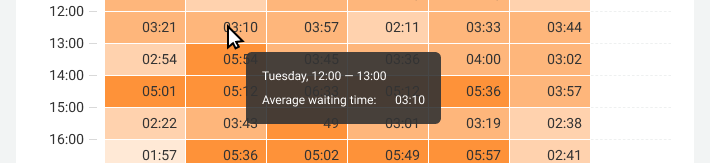
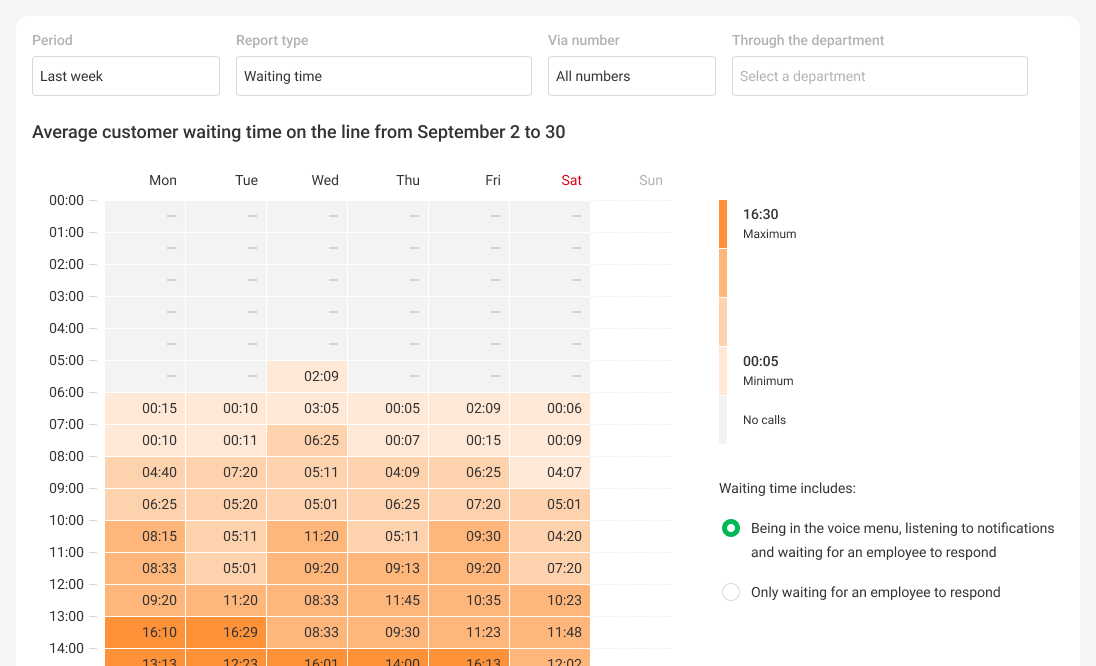
4. By waiting time you will understand how long on average a customer waited on the line. Using this report, you will be able to change call routes and employees schedules so that the average waiting time becomes shorter.
The average waiting time in the report is calculated in two ways: * everything that happened before the employee picked up the phone: the customer being in the IVR, listening to notifications (for example, “the conversation is being recorded”) and waiting for the employee to answer; * only waiting for the employee to answer — that is how long customers listened to beeps.
Perhaps, the long waiting for response happened not due to a large flow of calls, but because the employee was consulting another customer for too long or simply did not pick up the phone for a long time. To find out what causes the problem, also study the All incoming report.
5. By missed calls you will understand how critical waiting on the line is for customers at certain times. If the peak values of waiting time and missed calls coincide, it means that the customer drops the call because of a long non-response. But if these values vary greatly at different times, it means that your customers are especially impatient at certain hours.
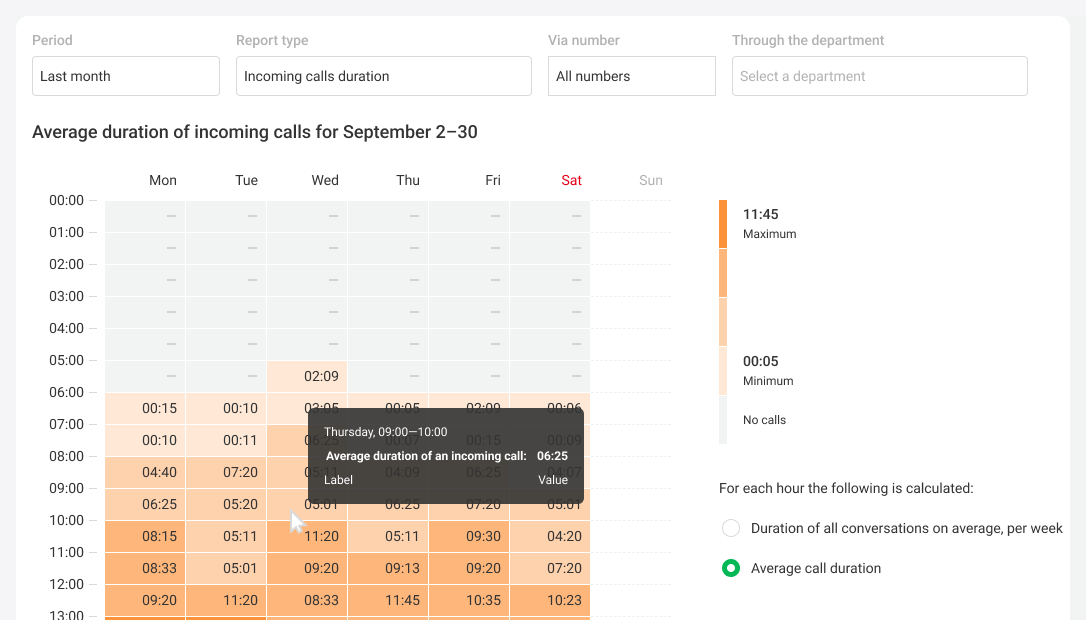
6. By incoming calls duration you can understand how many calls can be handled by the current amount of employees at every specific hour and what is the optimal amount of employees on the line at that time. The conversation duration in the report is calculated in two ways:
- The average call duration per hour is the arithmetic average of all incoming calls at that time on that day of the week. For the Thu from 9:00 to 10:00 cell this value is calculated as follows:
Total duration of all incoming calls on Thursdays from 9 to 10 / Amount of incoming calls in the selected period.
Usage example
Task: find out how many customers can be handled by the current amount of employees on Thursdays from 9 to 10.Calculations:
Average incoming call duration from 9 to 10 on Thursdays: 10 minutes.
60 min./10 min. = 6 incoming calls can be processed by an employee from 9 to 10 on Thursdays.
Amount of employees on the line from 9 to 10 on Thursdays: 2.
6 incoming * 2 employees = 12 incoming calls can be processed by two employees.
Conclusion: From 9 to 10 on Thursdays, employees can process up to 12 incoming calls. After that you can open a report on all incoming calls and see whether more or fewer calls actually come into the company at this time; whether one more employee should be assigned a shift at this time, or the amount of employees should be reduced at this hour, or it should be left as it is.
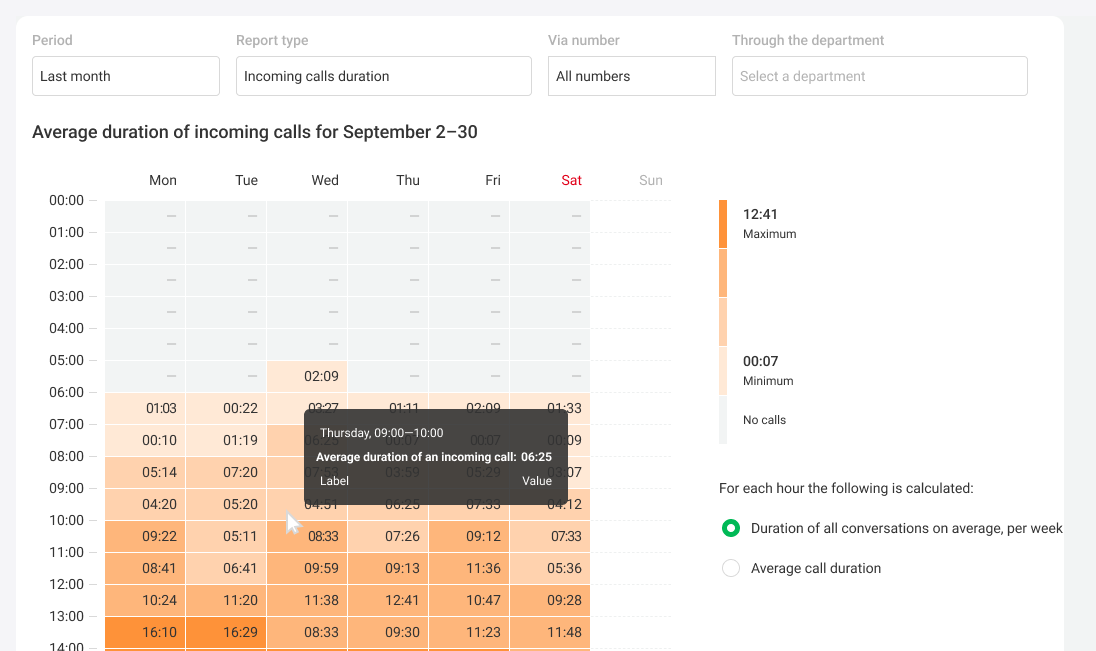
- Average duration of all calls by week is the average total duration of incoming calls at this hour in the selected period. The value of the Thu from 9:00 to 10:00 cell in this case will be calculated differently:
Total duration of all incoming calls on Thursdays from 9 to 10 / Amount of Thursdays in the selected period.
Usage example
Task: determine the optimal amount of employees on the line from 9 to 10 on Thursdays.Calculations:
Average duration of all incoming calls on Thursdays from 9 to 10: 120 minutes
Amount of employees on the line from 9 to 10 on Thursdays: 2.
Average workload per employee: 120 minutes/2 employees = 60 minutes.
Conclusion: employees are working at maximum capacity (full working hour) and probably miss many other incoming calls during this time. You can test this hypothesis by opening hourly workload for missed calls. If this is really the case, it would be better to have one more employee take calls from 9 to 10 on Thursdays.
Make it easier
Check the maximum, average or minimum workload by hovering over the color scale to the right of the graph. This way you will definitely not miss the cells with the values you are interested in.