Call Statistics
Thanks to statistical reports in Cloud PBX, you can monitor the dynamics of calls to the company, evaluate employees’ work, analyze the efficiency of advertising campaigns directly in the Cloud PBX interface, as well as control the processing of missed calls and much more.
Call Count Report
Call count report displays aggregate data on calls in your company.

How to customize the report?
Collect data by days, weeks or months.
Find calls for a certain period (a week, a month, three months or a year).
Select the most convenient view mode: a bar graph, line graph or pie chart.
Missed Calls Report
Thanks to the Missed calls processing report, the manager will know not only the quantity, but also the specifics of the missed calls — how many of them the employees processed and how many remained unanswered. This will allow you to evaluate how the situation with missed calls processing is changing over time and take measures if the number of unprocessed calls grows.
To learn more about how managers process missed calls, in Call count report go to the Missed calls processing tab and hover over the area of interest on the horizontal graph or pie chart.
The pop-up displays the status of missed calls, the number of such calls, and their percentage of the total number of unanswered calls.

In the table below, the graphs, data on all missed calls is conveniently divided into two columns indicating their status: Unprocessed (employees did not call back or did not get through) and Processed (employees called back or the customers called back themselves).
Department Report
In the department report, Heads of Departments can monitor their team’s performance against KPIs.
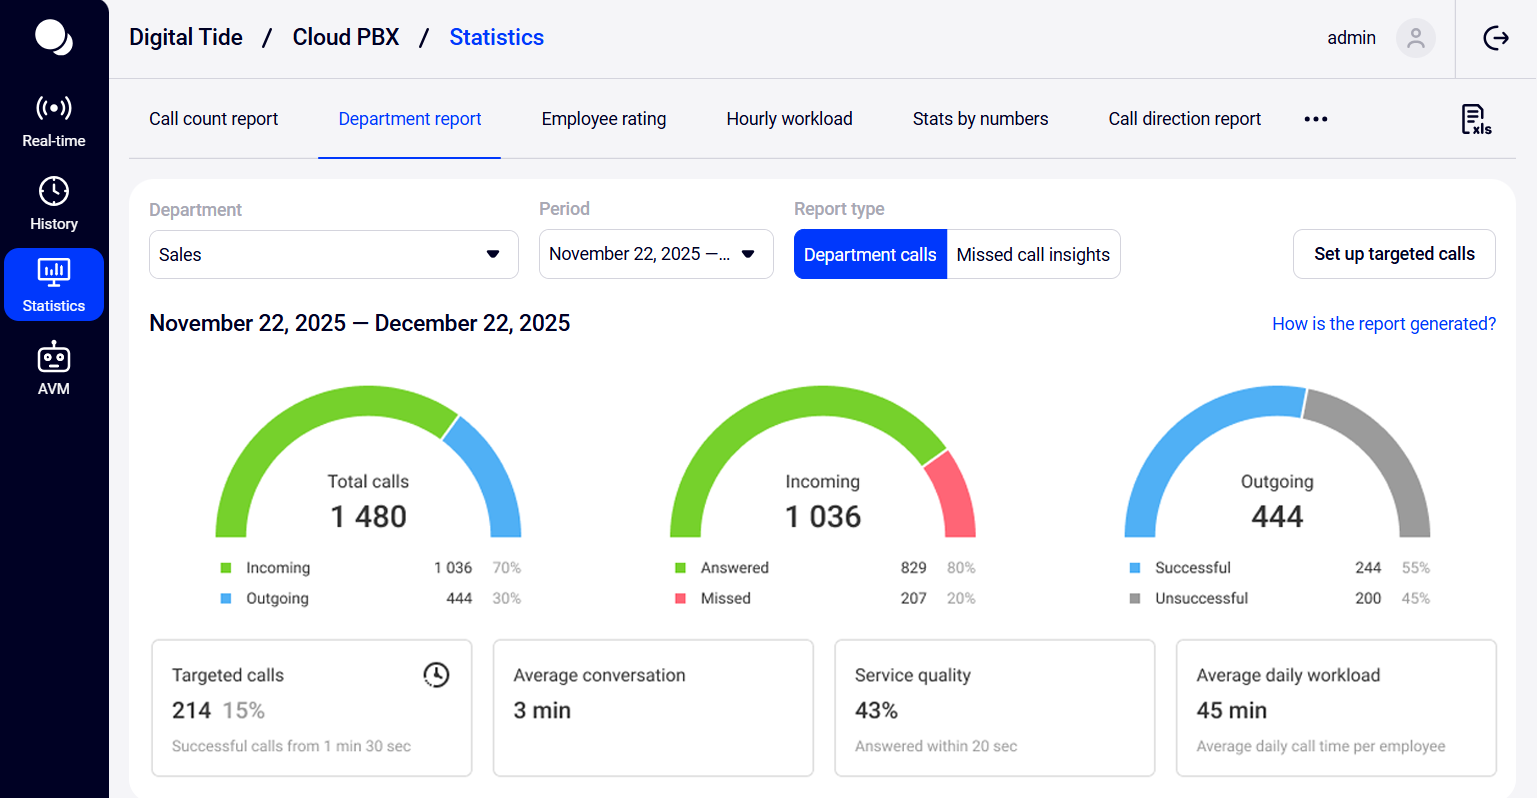
In the all-calls summary, you can track call volume, service quality, and average metrics for the entire department and for each individual employee. You can also set targeted call durations to assess the share of calls that meet the KPIs. Learn more about the tasks the department call summary can help you with.
The Missed call insights tab helps you understand why calls go unanswered and who misses calls most often. Learn more about the **Missed call insights** report and how it can help improve missed calls handling.
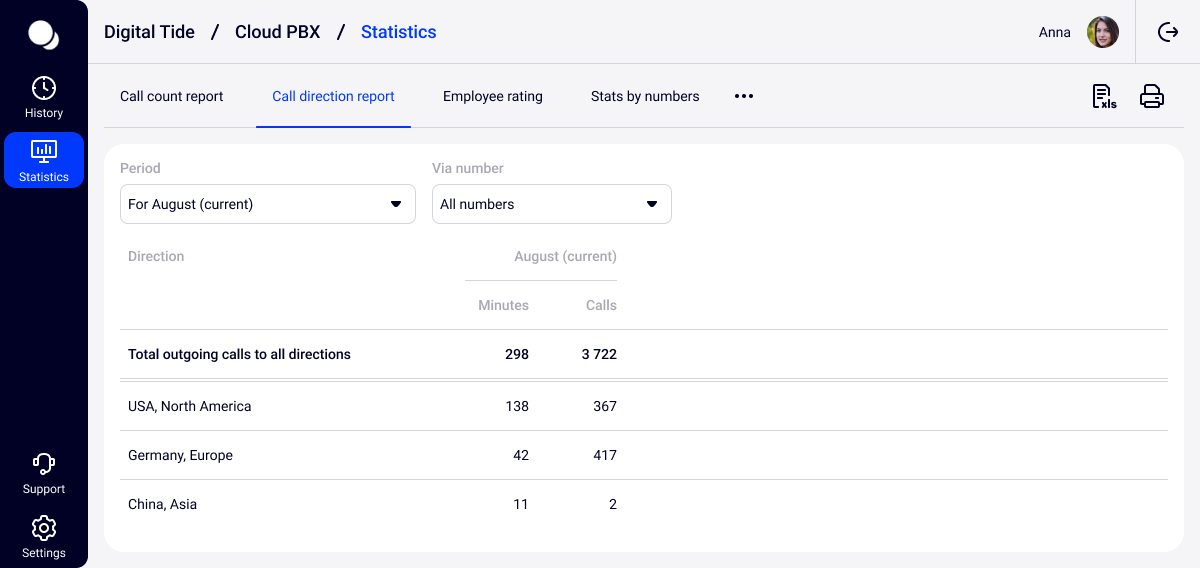
Call Direction Report
The call direction report shows where your employees call most often. It will help you predict communication costs for the upcoming months and eliminate untargeted calls (for example, if someone constantly calls in countries you do not work with). Additionally, you can adjust employees' work schedules if they have to call multiple customers located in time zones that don't match the company's time zone.
Employee Rating
The Employee rating report allows you to evaluate the efficiency of your company’s employees.
The report calculates average efficiency metrics for your company and presents information on each employee’s efficiency, taking into account whether their efficiency metrics are higher or lower than the average values for your company.
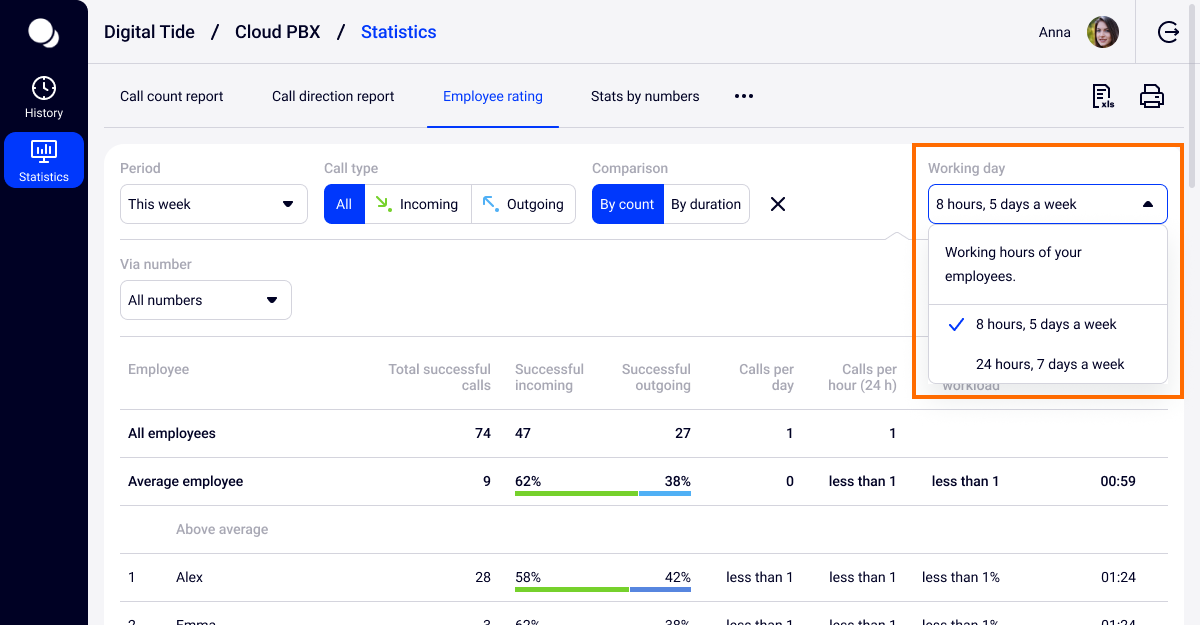
In the report settings, you can select two working time modes based on which the metrics will be calculated: 24-hour or 8-hour.
Please note
You can see call statistics for any time period and for any employee, not only in the Cloud PBX web interface, but also in our convenient and free mobile application.Stats by Numbers
The Stats by numbers report allows you to analyze the efficiency of advertising campaigns directly in the Cloud PBX interface, with no need for connecting to third-party call tracking. Select the numbers you want to compare, and Cloud PBX will show:
- how many calls were received or missed by employees for each of the marked numbers for the selected period;
- how many unique customers called the company numbers;
- how many of the customers whose calls were not answered got contacted afterwards.
To count the number of unique customers who called the company during a specified period, Cloud PBX analyzes all calls. If during a week, number A called the company 5 times, and number B called 3 times, then the total number of incoming calls will be 8, and the number of unique customers will be 2.
If you have several numbers assigned to one advertising channel, you can combine them into groups and give them names — it will make the analysis of various advertising sources even more convenient.
To combine numbers into a group, select the required numbers in the Phone number field and click Create list.

By combining numbers into groups, you can not only evaluate the efficiency of advertising channels but also compare company departments. For example, which of them pays more attention to communication with customers, or misses calls more often, and calls back less often. To do this, in the Stats by Numbers report:
- Create lists of department numbers (for example, “Online store”, “Wholesale department”, etc.).
- Compare the metrics of incoming and missed calls. The Called back column will show how many customers employees managed to contact after a missed call, and how many customers called back themselves within 24 hours.
Please note
Cloud PBX allows you to select both groups of numbers and individual numbers from these groups for analysis at the same time. In this case, the total number of calls to the selected numbers and groups of numbers will be distorted — calls to the number included in the group will be counted twice. Be careful when setting up the Stats by numbers report.Hourly Workload
The Hourly Workload report shows when the number of calls to the company is at its highest, indicating that all employees must be ready to answer the phone. It is also likely that, due to this report, you will reconsider the start and finish times of the working day if it turns out that a significant part of your calls come in outside business hours.

In the report, you can see the hourly workload for all calls or for different call types — incoming and outgoing (divided into successful and unsuccessful), as well as estimate the average customer waiting time on the line depending on the time of the call. See more details in the Capabilities of Hourly Workload Report article.
Please note
You can export basic reports in the XLSX or pdf formats.- The report in the pdf format is easy to print and show, for example, at a meeting with colleagues.
- Exporting to xlsx will allow you to conduct a more in-depth comparative analysis of data using the company's own tools and algorithms.
Combine the Stats by numbers report with other company data.
For example, by adding a column with advertising expenses, you can calculate the cost of a unique call to a number used for advertising.