Monitoring Setup Instructions
Here, the Queue Monitoring settings, access features, and the calculation of each metric are described.
Monitoring Settings
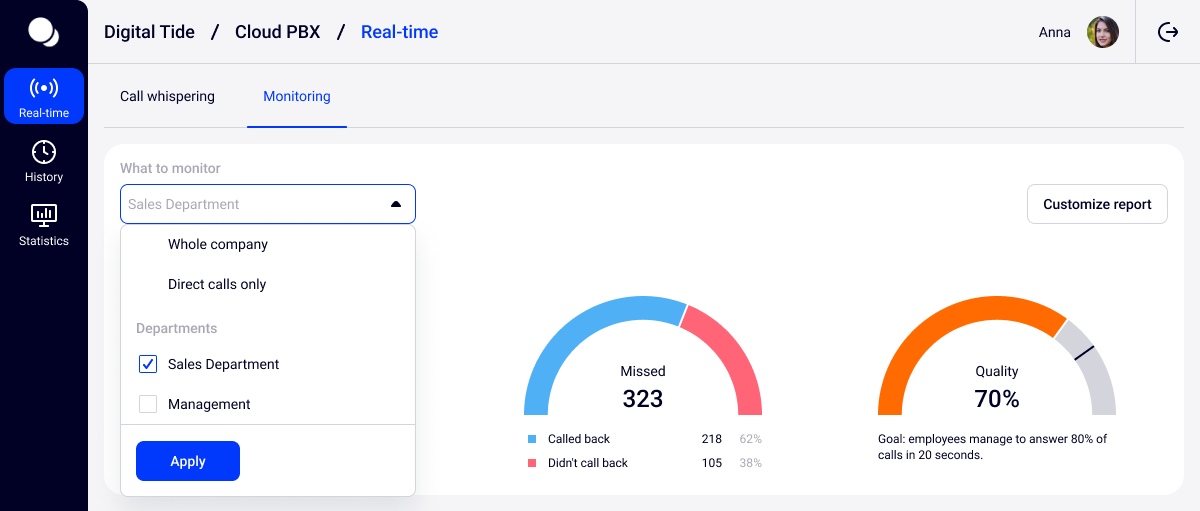
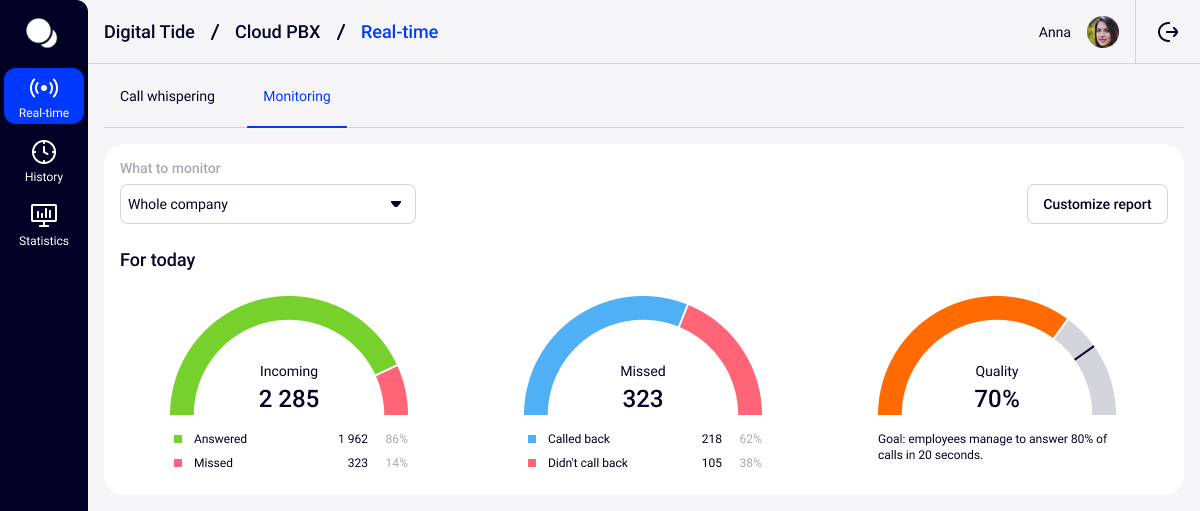
Go to the Real-time section in the sidebar — the Monitoring tab will open. By default, statistics for the whole company are displayed. In the What to monitor filter, you can select the departments you need or set it to show only direct calls to employees’ extension numbers.
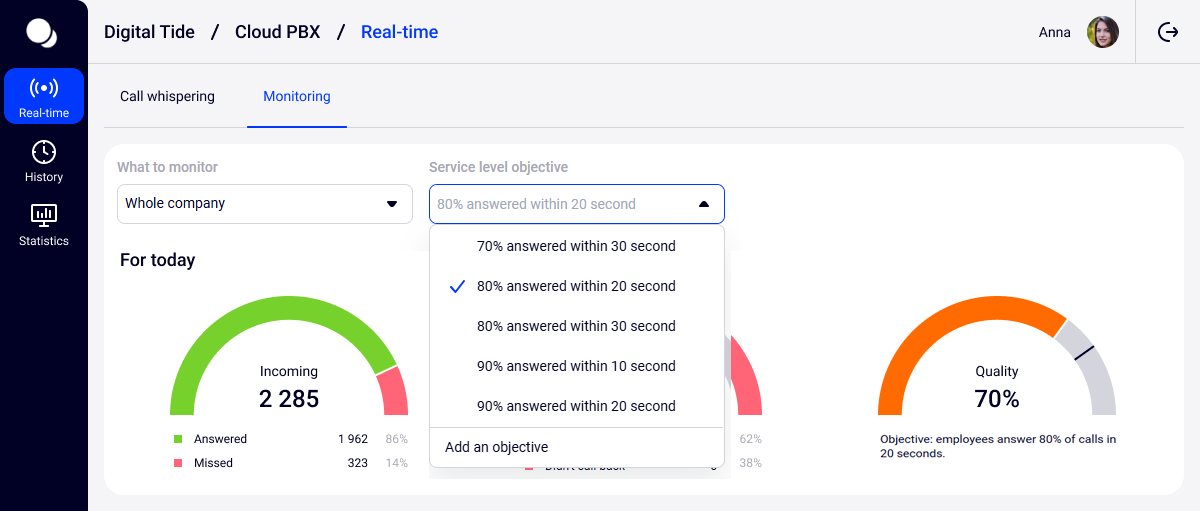
To set up monitoring according to your company’s standards, you can select the appropriate service level objective in the dropdown list.
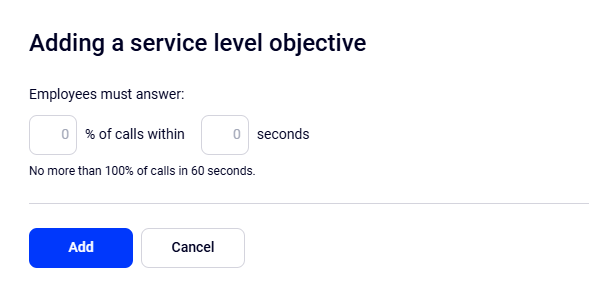
Or add your own objective:
Access to Monitoring
Access to monitoring depends on the level of rights in Cloud PBX:
- Administrator has access to monitoring of all departments by default.
- Head of Department can monitor only their departments.
- User and Restricted User do not have access to monitoring.
Monitoring Metrics
The For today Section
The For today section displays summary data on all calls for the current day (from 00:00 to 23:59), namely:
- Incoming — the number and percentage of answered and missed calls throughout the company.
- Missed — the number and percentage of missed calls called back by employees.
- Quality — the share of incoming calls that were answered by employees within the set time (for example, within 20 seconds).
The Now Section
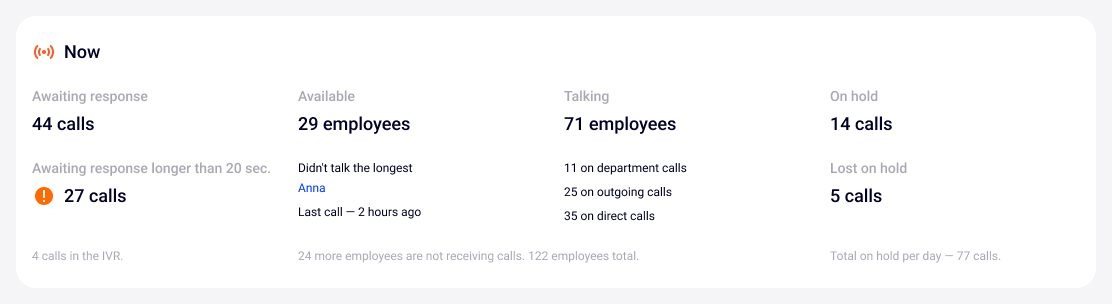
- Awaiting response: the total number of calls in a queue and, separately, calls that have been waiting for an answer longer than the target value. When more than half of your incoming calls are waiting for that long, an exclamation mark icon appears next to this metric to alarm about the problem.
- Available: how many employees are not participating in calls, which of them didn't talk the longest, and how long ago they talked on the phone with a customer.
- Talking: how many employees are participating in calls and what the origin of these calls is (how many calls were received by the department, how many were sent directly to extension numbers of employees, and how many calls are outgoing);
- On hold: how many calls are currently on hold and how many were lost during the day.
Employee and Department Calls Section
I. The Employees Table
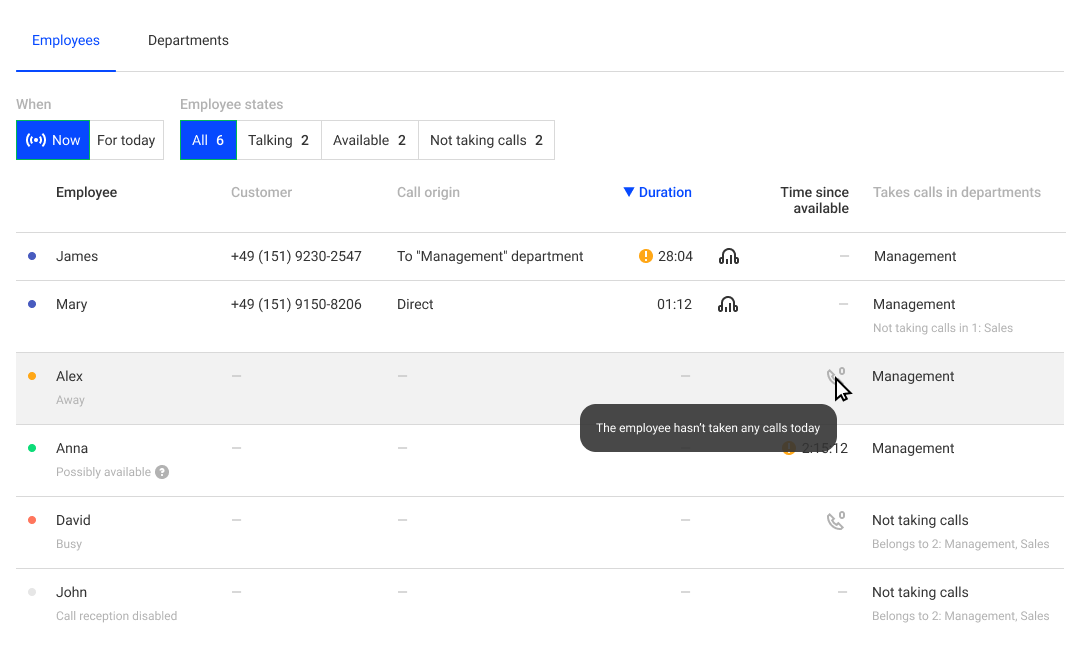
1. The Now tab contains the following columns:
- Employee — an employee’s name and status are displayed here (the colored circle before the name). Statuses indicate the employee’s real-time availability:
🟢 Available — the employee is ready to take calls and currently at their desk. To see which employees have not been participating in calls longer than others, filter calls by the Time since available column.
🟡 Away — the employee is away from their desk, but calls are still being routed to them.
🔵 Talking — the employee is on a call with a customer. You can see the call duration and the customer’s phone number.
Please note
A long call isn’t always a good sign. Keep an eye on overly long calls — the longest conversation will be marked with an exclamation mark icon to draw your attention. You can silently join the call and help the employee answer questions.🔴 Busy — the manager is at their desk but working on another task, e.g., preparing proposals. If the queue volume increases while several employees are in this status, you can quickly bring them back to handling calls or involve additional specialists.
⚪️ Call reception disabled — the employee is not participating in handling incoming calls due to the current settings.
⚪️ Absent — the status is determined based on work schedule data. You can configure each employee’s personal schedule for vacations, sick leave, and shifts to quickly see who is available today and who is not.
⚪️ Offline — the employee is off.
🟢 Possibly available and ⚪️ possibly offline — are used when there is no real‑time data from the employee’s work device. This status is determined by call activity during the day: it will become Possibly available if the employee has handled calls, and Possibly offline if they haven’t.
Statuses are synced from work devices, Communicator, and CRM systems and integrated with the personal schedule.
- Customer — if an employee is on the phone, the number of the person with whom they are talking is displayed here.
- Call origin — to the department or directly to the employee, an outgoing call.
- Duration — if an employee is talking, the duration of the current call is displayed here, and the longest call has an icon with an exclamation mark.
- Time since available — if an employee is enabled to receive calls but is not talking on the phone, the table will display the time of their inactivity. To make it easier to monitor the longest period of inactivity, an exclamation mark icon appears next to the time.
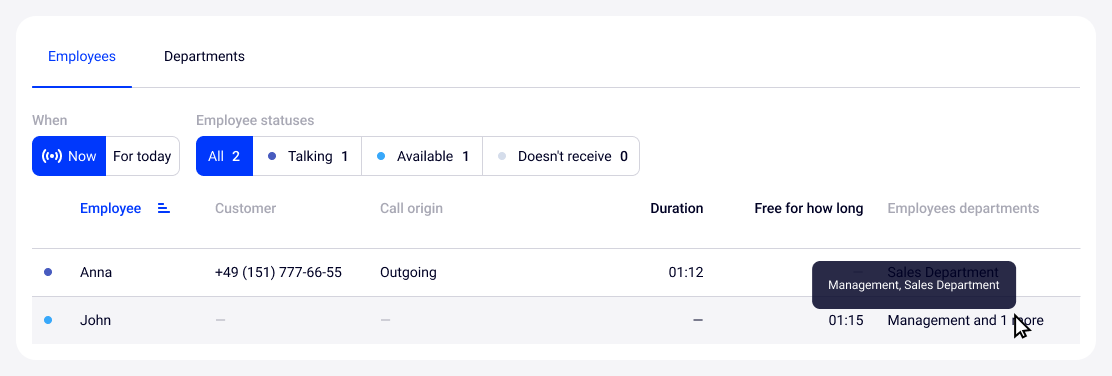
For ease of monitoring, the list of employees in the table can be sorted by name, duration of the current conversation, and how long the employees have been free (not talking to anyone).
If an employee is assigned to several departments, the table displays the first one alphabetically. To see the rest, hover your cursor over the department name.
2. In the For today tab, you can see the total number of all types of calls for each employee for the day:
- Answered.
- Called back.
- Outgoing.
- Total on hold (for today).
- Lost on hold.
There are also two columns with time metrics in this table:
- Response speed — the average time of response to incoming calls for today.
- Total on calls — the total time spent on all incoming and outgoing calls for today.
The list of employees can be sorted by any column except the Takes calls in departments column.
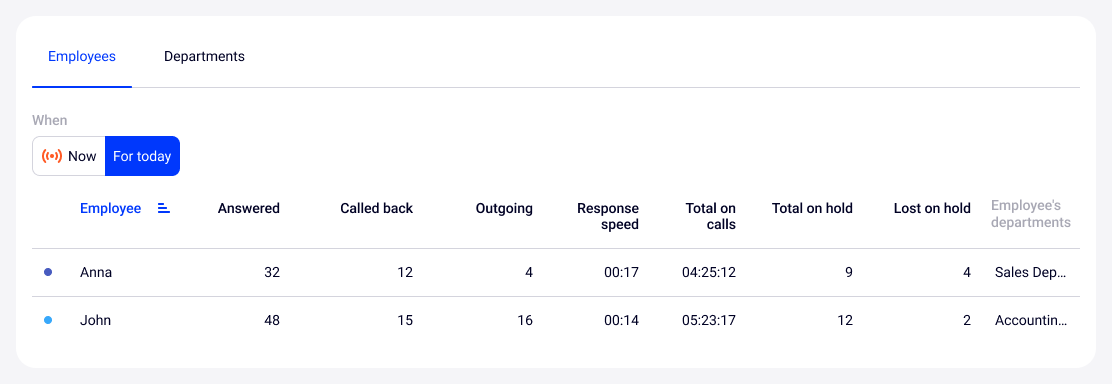
If an employee has not yet spoken on the phone during the day, in the Available for how long column, a handset icon with the number 0 will be displayed.
II. The Departments Table
The Departments table displays not only incoming and outgoing calls of the shared company numbers, but also incoming calls to the extension numbers of the departments.
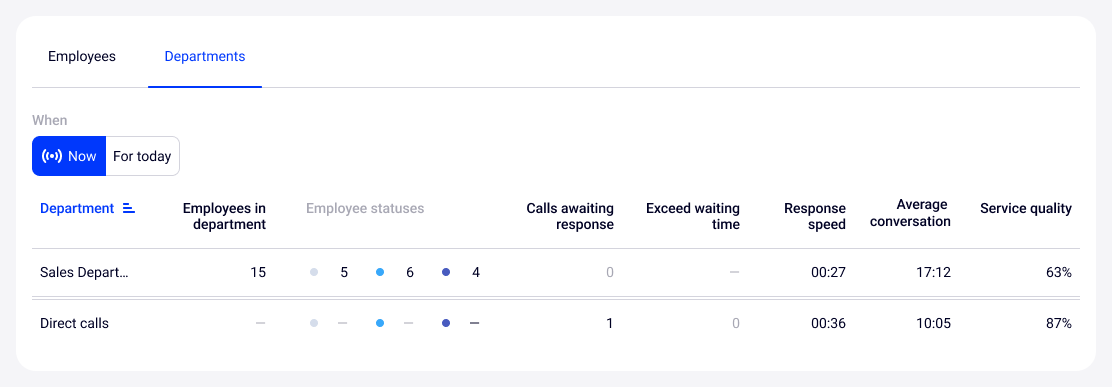
1. The Now tab contains the following metrics:
- Departments – a list of your departments handling calls;
- Awaiting response — the number of calls waiting for an answer right now.
- Exceed waiting time — the number of calls that have been waiting for an answer longer than the target value. If more than half of such calls occur, an exclamation mark icon will appear to draw your attention to this metric.
- Response speed — the average time of response to incoming calls to the department for today.
- Average conversation — the average call duration for all incoming and outgoing calls of the department.
- Service level —the percentage of calls where the waiting time did not exceed the target value.
- Employees in department and their statuses – the quantity of employees in each department, along with their distribution across three statuses: talking, available, and not taking calls.
Departments can be sorted by any column except employee statuses.
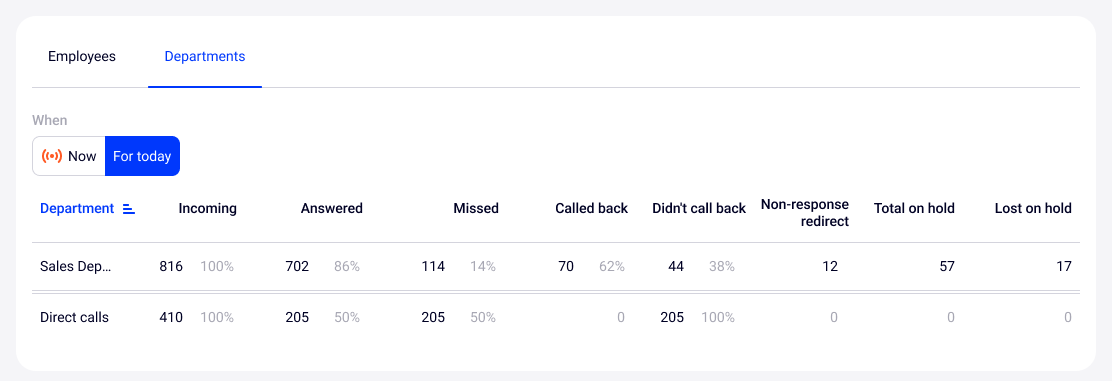
2. In the For today tab, you can see the total number of calls for each department for the day:
- by type: incoming, answered, missed
- with processing statuses of the missed call: called back, didn’t call back
- with non-response transfer — for more details about this setting, read the article;
- on hold: total on hold and lost on hold.
In this tab, departments can be sorted by any column.