Department Calls Report Capabilities
The report on all department calls helps sales and support team leaders: * build an effective motivation system for employees and quickly calculate payroll based on KPIs: targeted calls, average conversation, total time in conversation, response speed, dialing attempts and duration;
- monitor team workload and service level;
- assess employees’ commitment to call outcomes — how many times they try to reach a customer and how long they wait for a response;
- track new customer acquisition based on the quantity of unique calls.
Report Capabilities
I. Monitor the Overall Call Picture on a Regular Basis
The report displays summary data for all calls during the selected period (day, week, month, etc.). Each metric answers key management questions:
- total number of handled calls — the quantity and share of incoming and outgoing calls in the department during the selected period, and which type of calls creates the heavier workload;
- whether managers keep up with incoming volume — how many calls were answered and how many were missed;
- how successful outgoing calls are.
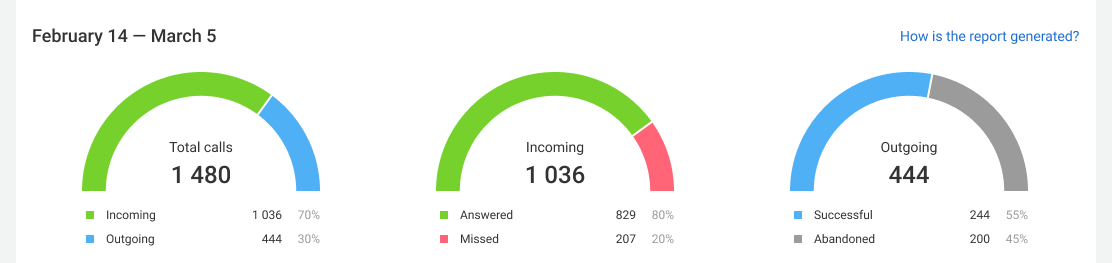
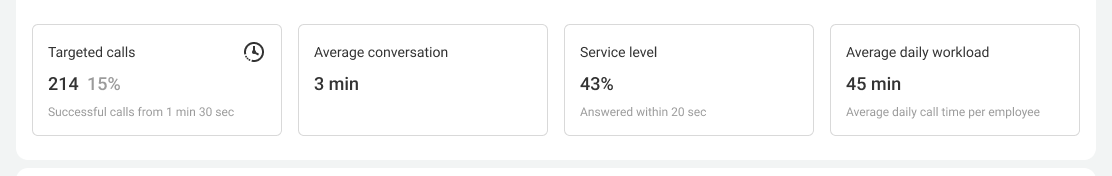
To evaluate not only call quantity but also quality, you can review the following metrics:
- Targeted calls — how many calls lasted within the defined duration range. This metric can be customized. See more details in the article about metric calculation;
- Average conversation duration — how long one conversation lasts on average. If it significantly differs from your target values, it may be time to train your employees;
- Service level — the percentage of calls answered within 20 seconds. We found that when employees take too long to answer, customers start hanging up after the 20‑second mark.
You can also use average daily workload to see how much time per day department employees spend on calls on average.
II. Drill Down into Each Employee’s Details
To evaluate each employee’s contribution to department results, use the employee calls table: for all calls or separately for incoming and outgoing ones.
In the table for all calls, mostly the same metrics are calculated for each employee as in the top panel of the department report, as well as unique calls. Unique calls show how many customers each employee spoke with and help you assess whether they interacted with the same customers or brought in new ones.
Statistics for the average employee help you see which employees are clearly underperforming and which perform better than the majority.
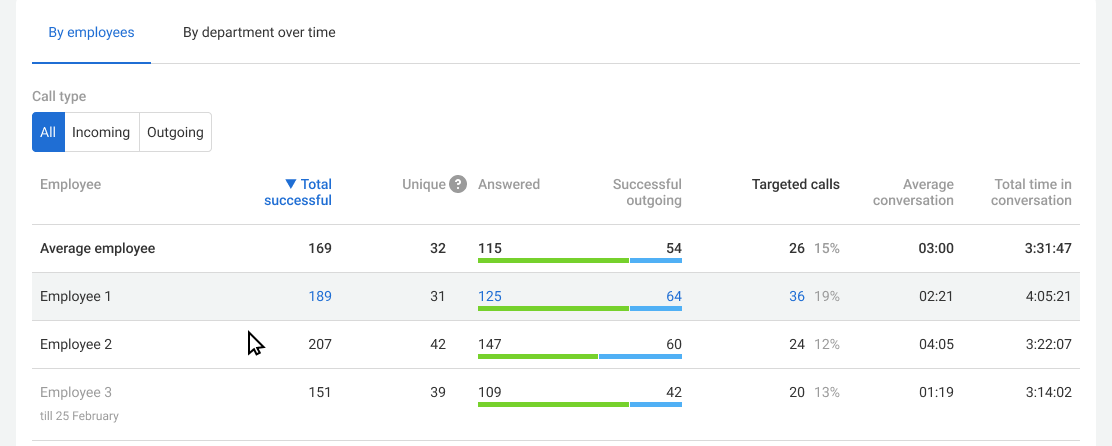
Employees removed from the department are highlighted in gray if they had calls during the selected period. To evaluate department KPIs separately for incoming and outgoing calls and track new employees’ progress on specific tasks, we recommend analyzing the Incoming and Outgoing call tables. To do this, change the selection in the «Call type» filter. In addition to the metrics of the table for all calls, you can also see:
- in the incoming call table — the average response speed for calls routed to the employee, as well as the quantity of direct calls to employees. Direct calls are calls made directly to an employee’s extension and personal numbers; they are not included in department statistics but still take up your employees’ time.
- in the outgoing call table — the quantity of unsuccessful calls, the average number of attempts, and the average waiting time within unsuccessful calls. This shows the employee's persistence in reaching out to customers, even when their attempts do not result in a conversation.
III. View Department Call Trends by Day, Week, and Month
When comparing results by day, pay attention to peaks in incoming and missed calls. If the average employee workload is also high on those days and the service level is lower than usual, you may need to increase the number of employees on the line.
Evaluate whether department performance improves by week and month and analyze the reasons — it may be seasonality, or it may be employees’ motivation.
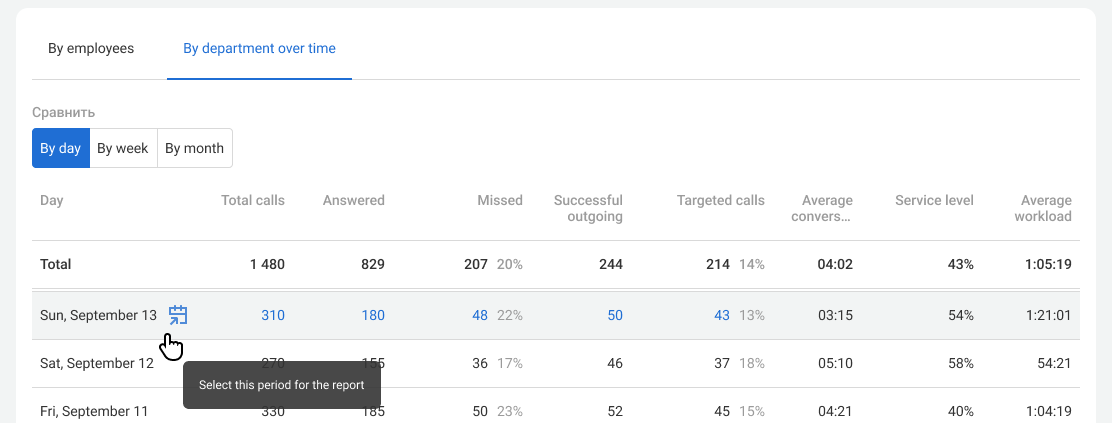
You can view the department calls report for a selected period in more detail by clicking the calendar icon.
You can also download the report in Excel to evaluate results together with other department performance indicators, for example, sales.